fbpx
High Leverage FX
  • Home
  • Market News
    • All
    • Economy
    • Forex
    • Markets
    • Opinion
    • Politics
    • Tech
    • World
    Asian stock markets poised for potential losses in the wake of Wall Street’s downturn

    Asian stock markets poised for potential losses in the wake of Wall Street’s downturn

    Asian equities observe positive start as optimism on Wall Street echoes

    Asian stocks may face headwinds after sell-off on Wall Street

    Asia equities trading mixed following similar performance on Wall Street

    Asian markets poised to react positively

    USD/MYR Technical Analysis

    USD/MYR Technical Analysis

    Asia equities trading sideways following choppy price action on Wall Street

    Asian equities poised for positive trading following volatile session on Wall Street

  • Economic Calendar
  • About Us
  • Trading Signals
  • Free Demo Account
High Leverage FX
No Result
View All Result
Home Market News Markets

Oil breaks higher as OPEC+ meeting commences

Neville Hornsey by Neville Hornsey
June 1, 2021
in Markets, World
Reading Time: 5 mins read
0
Brent Crude Technical Analysis – Bullish pattern secured
325
SHARES
8.7k
VIEWS
Share on FacebookShare on Twitter

Market Brief

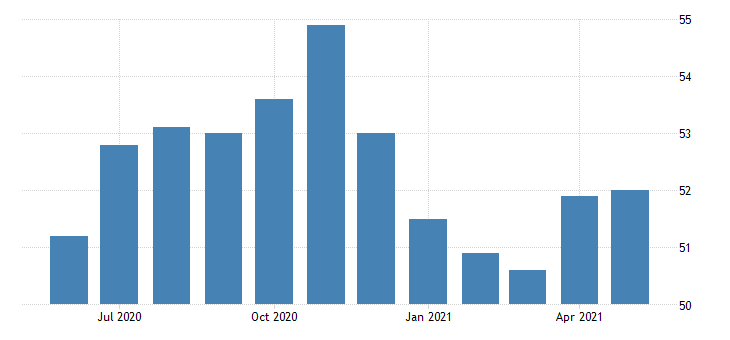
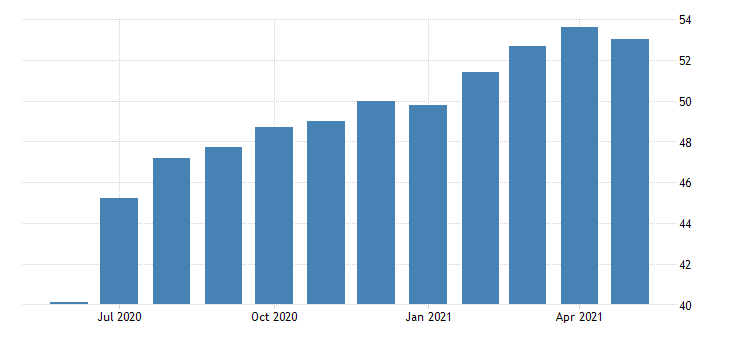
The Caixin China General Manufacturing PMI continued its growth in May rising to 52.0 from 51.9 in April. New orders rose the most since December 2020 as the index rose for the 13th consecutive month. “Average cost burdens rose rapidly in the latest survey period, with the rate of inflation the quickest since December 2016. Panel members frequently mentioned that higher raw material costs pushed up expenses. Firms generally passed on greater input costs to clients by raising their output prices which increased at the fastest rate since February 2011,” the report stated.

See real-time quotes provided by our partner.

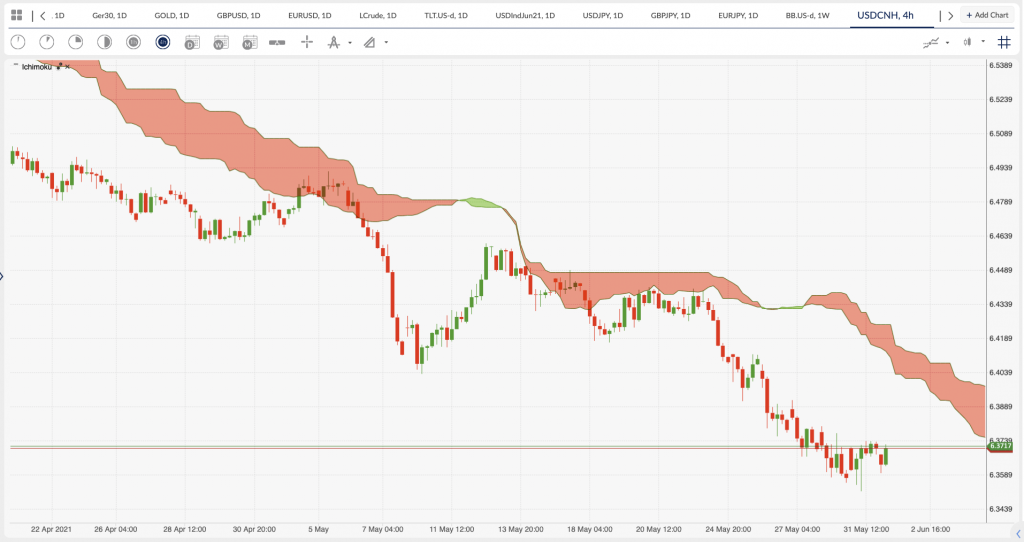
The USDCNH on the 4h chart shows the extent of the downtrend with the Ichimoku cloud offering resistance up at 6.4 which is confluent with the previous market structure formed on the 10th of May.

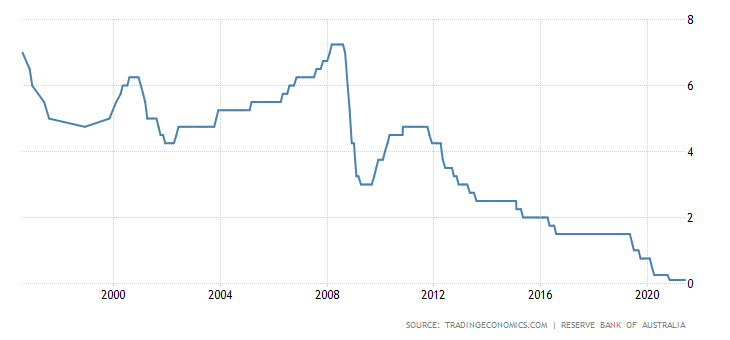
The Reserve Bank of Australia (RBA) Governor Philip Lowe said the bank had kept the cash rate at a record low of 0.1% during its June meeting. The RBA are committed to using a loose, highly supportive monetary policy until at least 2024. The board said that it predicts GDP to grow by 4.75 % this year and 3.5% in 2022, supported by fiscal measures and very accommodative financial conditions. The bank also stated unemployment had decreased to 5.5% in April and is projected to fall to 5% by the end of the year. CPI inflation is anticipated to rise temporarily to be above 3% in the June quarter because of the reversal of some COVID-19-related price reductions.

See real-time quotes provided by our partner.

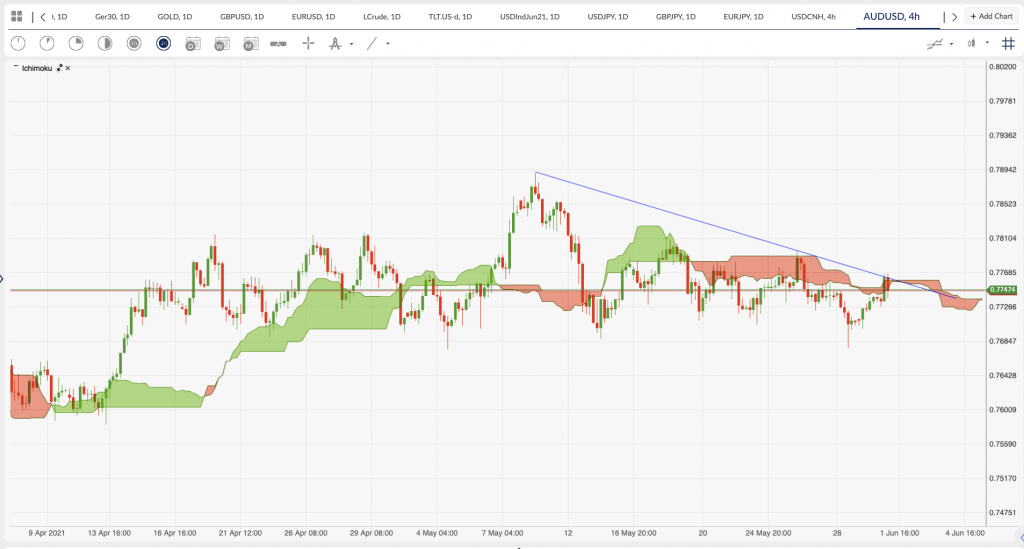
The AUDUSD has been travelling sideways for a long time now, with the ranges getting smaller as can be seen on the 4h chart. A break above the 0.7890 swing high that printed on the 10th of May would be a good signal that the sentiment and momentum had changed and would no doubt be dependent on the US dollar index falling a lot lower. Otherwise, if we were to breakdown, there is a growing consensus that the chart pattern is more like a head and shoulders distribution, and we could see a measured move down towards 0.7000 and back inside the daily Ichimoku cloud.

The Japanese Jibun Bank Flash Manufacturing PMI Index was revised higher to 53.0 in May, rising above the preliminary estimate of 52.5 and compared with 53.6 in the previous month. Both output and new orders grew at a slower rate. The IHS Markit stated “Japanese goods producers remained optimistic in the year ahead outlook for activity. Firms were hopeful that the pandemic would subside and induce a broad recovery in demand across the sector. IHS Markit estimates that industrial production will rise by 8.8% in 2021,”

During the European session, the market receives EU HICP Flash data along with the EU Unemployment rate along with the UK Final Manufacturing PMI reading for May.

See real-time quotes provided by our partner.

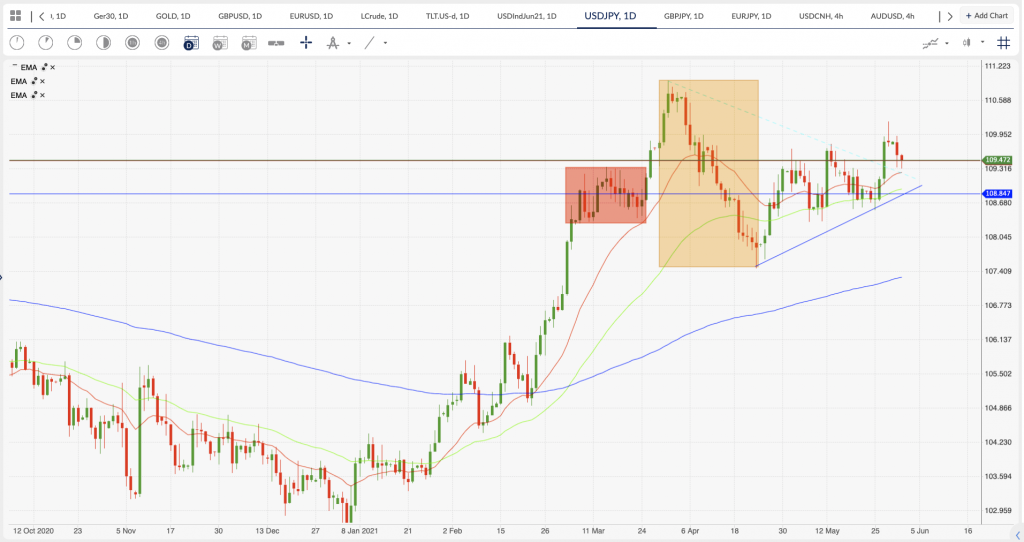
The USDJPY is also moving sideways which reflects the weakening US dollar and a weaker Japanese yen. However, my base case scenario is for the USDJPY to test higher after finding support at the moving averages again. In the US session the Tier 1 data is focused on the ISM and Markit Manufacturing readings for May with the PMI data expected to stay generally unchanged.

Today in the oil markets the JMMC/OPEC+ meeting begins.

See real-time quotes provided by our partner.

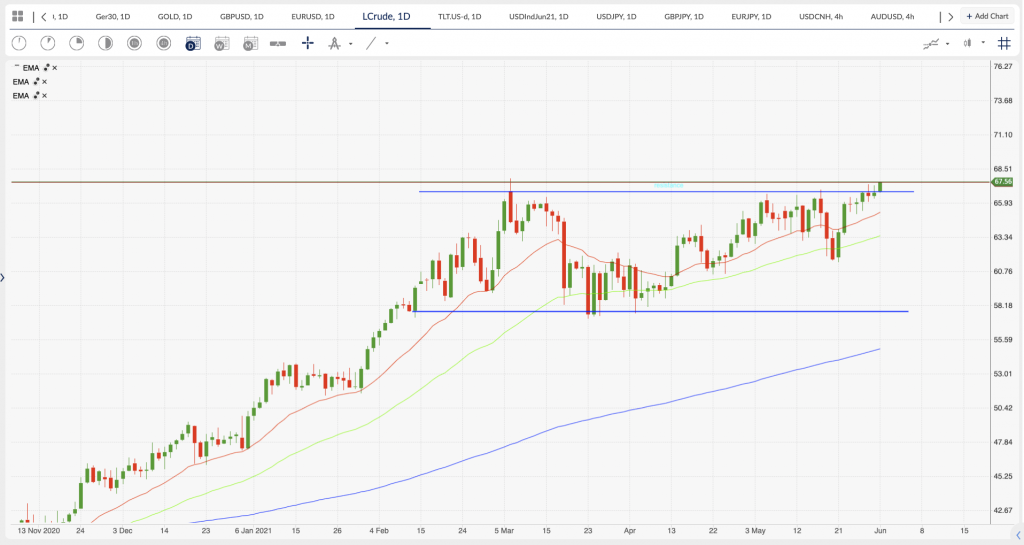
The WTI chart pattern has been a range bound market for a few months now, but today’s price action looks to be attempting a solid breakout. If the price of oil were to trade into a new range, we could be seeing prices up to $77, which would add inflationary pressures to the markets. A continued rise would be dependent on the global economies increasing demand and absorbing the new inventory from OPEC+ and Iran output cuts are reduced, and sanctions are lifted. The unemployment data in the US could be signalling that all is not well in their economy which would pertain to a weaker demand and a rejection of higher oil prices. There is also still a supply chain issue globally caused by the coronavirus, so no guarantees that oil rises from here. To the downside, if prices look above the range and then close back inside, this could signal to the bears that the bulls do not have enough energy to take it higher and they could apply pressure and target the rising daily 200 ema.

Tags: AUD/USDcrude oilRBAUS dollarUSD/CNHUSD/JPY
Previous Post

USD/SGD Technical Analysis

Next Post

US Dollar Index Technical Analysis - More losses expected

Neville Hornsey

Neville Hornsey

Related Posts

Asian stock markets poised for potential losses in the wake of Wall Street’s downturn
Markets

Asian stock markets poised for potential losses in the wake of Wall Street’s downturn

October 27, 2023
Asian equities observe positive start as optimism on Wall Street echoes
Markets

Asian stocks may face headwinds after sell-off on Wall Street

October 26, 2023
Asia equities trading mixed following similar performance on Wall Street
Markets

Asian markets poised to react positively

October 25, 2023
Asia equities trading sideways following choppy price action on Wall Street
Markets

Asian equities poised for positive trading following volatile session on Wall Street

October 24, 2023
Asian markets poised for cautious trading amidst global geopolitical tensions
Markets

Asian markets poised for cautious trading amidst global geopolitical tensions

October 20, 2023
Asian equities observe positive start as optimism on Wall Street echoes
Markets

Asian markets appear poised for cautious stance following Wall Street’s retreat from risk

October 19, 2023
Next Post
US Dollar Index Technical Analysis – More losses expected

US Dollar Index Technical Analysis - More losses expected

Leave a Reply Cancel reply

Your email address will not be published. Required fields are marked *


Market Overview

Categories

  • Economy
  • Forex
  • Gadget
  • Markets
  • Opinion
  • Politics
  • RSS Feed
  • Startup
  • Tech
  • Trading Signals
  • Uncategorized
  • World

Site Navigation

  • Home
  • Market News
  • Economic Calendar
  • About Us
  • Trading Signals
  • Free Demo Account
  • Home
  • Market News
  • Economic Calendar
  • About Us
  • Trading Signals
  • Free Demo Account

© 2019 High Leverage FX - All Rights Reserved.

No Result
View All Result
  • Home
  • Market News
    • Forex
    • Economy
    • Opinion
    • World
    • Markets
    • Politics
  • Economic Calendar
  • Trading Signals
  • About Us
  • Free Demo Account
[gtranslate]

© 2019 High Leverage FX - All Rights Reserved.