fbpx
High Leverage FX
  • Home
  • Market News
    • All
    • Economy
    • Forex
    • Markets
    • Opinion
    • Politics
    • Tech
    • World
    Asian stock markets poised for potential losses in the wake of Wall Street’s downturn

    Asian stock markets poised for potential losses in the wake of Wall Street’s downturn

    Asian equities observe positive start as optimism on Wall Street echoes

    Asian stocks may face headwinds after sell-off on Wall Street

    Asia equities trading mixed following similar performance on Wall Street

    Asian markets poised to react positively

    USD/MYR Technical Analysis

    USD/MYR Technical Analysis

    Asia equities trading sideways following choppy price action on Wall Street

    Asian equities poised for positive trading following volatile session on Wall Street

  • Economic Calendar
  • About Us
  • Trading Signals
  • Free Demo Account
High Leverage FX
No Result
View All Result
Home Market News Tech

Nasdaq Technical Analysis – Head and shoulders patterns in play

Nathan Batchelor by Nathan Batchelor
March 9, 2021
in Markets, Opinion, Tech
Reading Time: 3 mins read
0
Nasdaq Technical Analysis – Head and shoulders patterns in play
424
SHARES
8.1k
VIEWS
Share on FacebookShare on Twitter

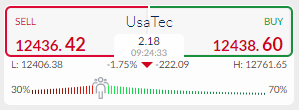
The Nasdaq is back under heavy downside pressure again this week, as traders continue to sell any rallies in the index and investors rotate away out of technology stocks and into so-called value stocks.

Even the announcement of the $1.9 trillion United States stimulus bill being approved by US Senate over the weekend failed to rally the tech staked index, such is the bearishness surrounding the tech heavy Nasdaq this month.

Bearish technical signs are also engulfing the US 100 index at the moment, placing some very serious downside targets in focus on both the lower and the higher time frame charts over the coming weeks.

Last March proved to be a bad month for the Nasdaq in 2020, it would appear that this March is also going to be another poor month, as the index already trades nearly 5 percent in the red so far this month.

A notable head and shoulders pattern has recently been activated and is predicting that the index could fall by a further 8 percent, marking a potential 13 percent monthly decline if the pattern proves correct.

This week, traders will be closely focused on the release of the US Consumer Price Inflation index for the month of February. A big beat in this number could send the Nasdaq even lower this month.

Most analysts agree that a rise in inflation or the so-called reflation trade should benefit many of the stocks in the Dow Jones Industrial Average that are linked to the real economy, and not tech stocks in the stocks.

This is especially true if the American economy comes out of lockdown, so the downside move in the Nasdaq could last for some time and catching many tech perma bulls out in the process.

Traders will be closely watching the index’s 200-day moving average, around 11,760, if the down move starts to accelerate below the 12,000 level. Just for some reference, the index has remained above its 200-day MA, and technically bullish since April 14th last year.

The ActivTrader Market sentiment shows that some 70 percent of traders are bullish towards the Nasdaq. This should concern traders, and it may indicate a good degree of complacency and further losses ahead for the index.

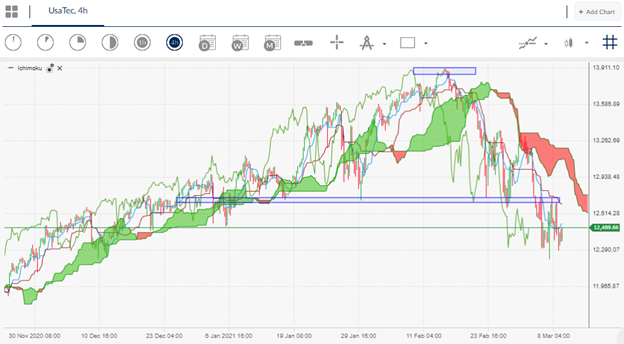
Nasdaq Short-Term Technical Analysis

The four-hour time frame shows that a small head and shoulders pattern has been activated, following the recent break under the 12,740 level.

According to the overall size of the bearish price pattern the Nasdaq is set for more losses and could be headed towards the 12,000-support level over the short-term horizon.

Source By ActivTrader.

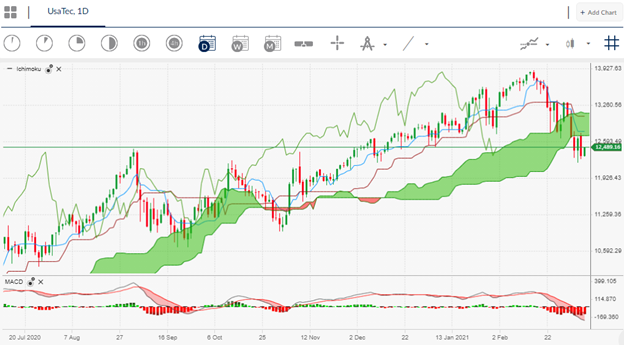
Nasdaq Medium-Term Technical Analysis

Looking at the daily price chart an extremely large head and shoulders pattern can be seen, with the pattern now activated, and holding a downside target of close to 1,500 point.

Worryingly, a significant amount of bearish MACD price divergence is present on the daily time frame and extends all the way down to the 8,000 level.

Watch out for further losses on the daily time frame while the index trades below the 11,740 level. Heavy downside losses towards the 10,000 and finally the 8,000 level could be on the horizon.

Source By ActivTrader.

Tags: Dow JonesNasdaqUS CPIUS stimulus package
Previous Post

Market sentiment quickly turns around

Next Post

USDCAD Technical Analysis - The pain trade continues

Nathan Batchelor

Nathan Batchelor

Related Posts

Asian stock markets poised for potential losses in the wake of Wall Street’s downturn
Markets

Asian stock markets poised for potential losses in the wake of Wall Street’s downturn

October 27, 2023
Asian equities observe positive start as optimism on Wall Street echoes
Markets

Asian stocks may face headwinds after sell-off on Wall Street

October 26, 2023
Asia equities trading mixed following similar performance on Wall Street
Markets

Asian markets poised to react positively

October 25, 2023
Asia equities trading sideways following choppy price action on Wall Street
Markets

Asian equities poised for positive trading following volatile session on Wall Street

October 24, 2023
Asian markets poised for cautious trading amidst global geopolitical tensions
Markets

Asian markets poised for cautious trading amidst global geopolitical tensions

October 20, 2023
Asian equities observe positive start as optimism on Wall Street echoes
Markets

Asian markets appear poised for cautious stance following Wall Street’s retreat from risk

October 19, 2023
Next Post
USDCAD Technical Analysis – The pain trade continues

USDCAD Technical Analysis - The pain trade continues

Leave a Reply Cancel reply

Your email address will not be published. Required fields are marked *


Market Overview

Categories

  • Economy
  • Forex
  • Gadget
  • Markets
  • Opinion
  • Politics
  • RSS Feed
  • Startup
  • Tech
  • Trading Signals
  • Uncategorized
  • World

Site Navigation

  • Home
  • Market News
  • Economic Calendar
  • About Us
  • Trading Signals
  • Free Demo Account
  • Home
  • Market News
  • Economic Calendar
  • About Us
  • Trading Signals
  • Free Demo Account

© 2019 High Leverage FX - All Rights Reserved.

No Result
View All Result
  • Home
  • Market News
    • Forex
    • Economy
    • Opinion
    • World
    • Markets
    • Politics
  • Economic Calendar
  • Trading Signals
  • About Us
  • Free Demo Account
[gtranslate]

© 2019 High Leverage FX - All Rights Reserved.