fbpx
High Leverage FX
  • Home
  • Market News
    • All
    • Economy
    • Forex
    • Markets
    • Opinion
    • Politics
    • Tech
    • World
    Asian stock markets poised for potential losses in the wake of Wall Street’s downturn

    Asian stock markets poised for potential losses in the wake of Wall Street’s downturn

    Asian equities observe positive start as optimism on Wall Street echoes

    Asian stocks may face headwinds after sell-off on Wall Street

    Asia equities trading mixed following similar performance on Wall Street

    Asian markets poised to react positively

    USD/MYR Technical Analysis

    USD/MYR Technical Analysis

    Asia equities trading sideways following choppy price action on Wall Street

    Asian equities poised for positive trading following volatile session on Wall Street

  • Economic Calendar
  • About Us
  • Trading Signals
  • Free Demo Account
High Leverage FX
No Result
View All Result
Home Market News Forex

Gold Technical Analysis – Dip buy opportunity?

Nathan Batchelor by Nathan Batchelor
December 12, 2022
in Forex
Reading Time: 3 mins read
0
Gold Technical Analysis
438
SHARES
16.3k
VIEWS
Share on FacebookShare on Twitter

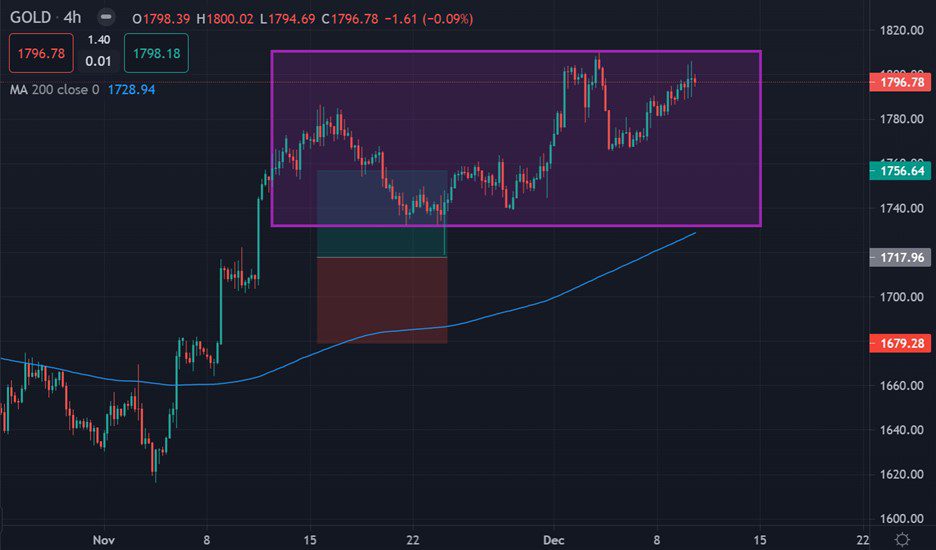
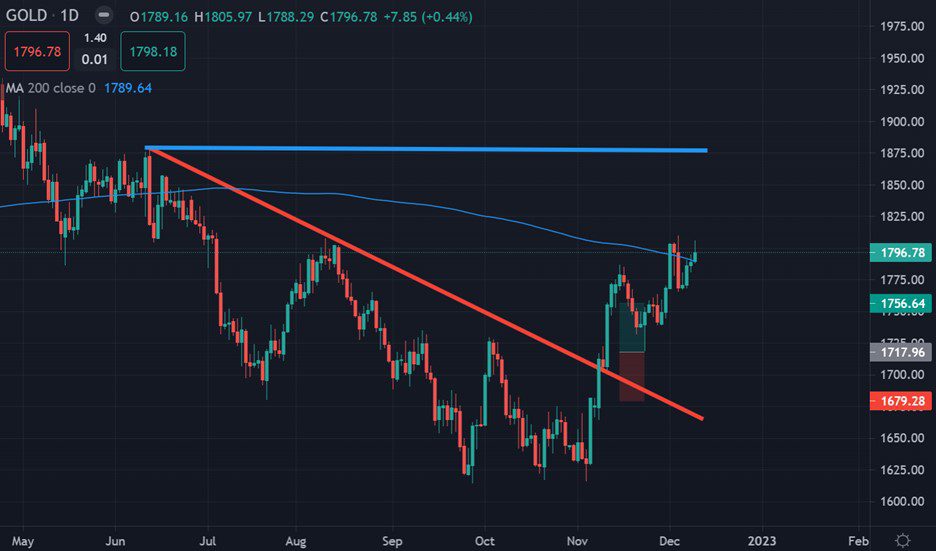
Gold closed the week above its 200-day moving average last week for the first time since June this year as the yellow metal continues its epic recovery towards the $1,800 resistance zone over recent weeks.

The focus now shifts to the FOMC Meeting this week. The US Federal Reserve hiked rates by 75 basis points for a fifth consecutive meeting last month, and market players are now hoping for confirmations of a FED pivot this Wednesday.

Chair Powell also said that “The time for moderating the pace of rate increases may come as soon as the December meeting”. Markets are largely expecting a 50-basis point hike this week.

Gold could also be influenced by Chinese this week. The recent lifting of lockdown measures has helped risk-on sentiment. China has a veracious demand for gold, this could be a reason for Chinese retail to buy.

Technically, golds run above its 200-day moving average is a positive sign. It is imperative that the yellow metals continue to make traction above this key technical metric this week.

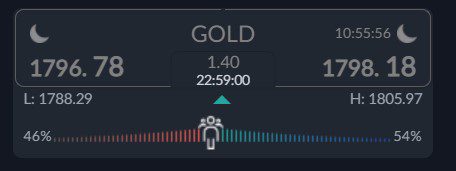
Current sentiment metric towards gold shows that sentiment has become slightly more bullish, which hints that retail are leaning towards more gains this week.

The ActivTrader market sentiment tool shows that 54 percent of traders are bullish towards gold. Going forward, we really need to see a negative bias by retail to help the chances of a sustained recovery.

Gold short-term Technical Analysis

According to technical analysis gold the price of gold could be about to test towards the head of a head and shoulders pattern on the four-hour time frame.

These type of pattern invalidations are usually very bearish. In theory, if the resets of $1,810 holds, then we could see a push back towards the range high, around $1,740 level.

See real-time quotes provided by our partner.

Gold Medium-term Technical Analysis

The daily chart shows that the yellow-metal has moved back inside its two-year range and more importantly it is starting to make traction above its 200-day moving average for the first time in nearly 6 months.

We could see the price of gold revisit the top of its range again around $1,875. However, before that the price of gold has an important battle with its 200-day moving average, around the $1,800 level.

See real-time quotes provided by our partner.

Tags: FEDFOMCGold
Previous Post

The Week Ahead

Next Post

USDMYR Technical Analysis

Nathan Batchelor

Nathan Batchelor

Related Posts

USD/MYR Technical Analysis
Forex

USD/MYR Technical Analysis

October 25, 2023
USDMYR Technical Analysis
Forex

USD/MYR Technical Analysis

October 24, 2023
USD/MYR Technical Analysis
Forex

USD/MYR Technical Analysis

October 20, 2023
USDMYR Technical Analysis
Forex

USD/MYR Technical Analysis

October 17, 2023
USD/MYR Technical Analysis
Forex

USD/MYR Technical Analysis

October 12, 2023
USDMYR Technical Analysis
Forex

USD/MYR Technical Analysis

October 11, 2023
Next Post
USDMYR Technical Analysis

USDMYR Technical Analysis

Leave a Reply Cancel reply

Your email address will not be published. Required fields are marked *


Market Overview

Categories

  • Economy
  • Forex
  • Gadget
  • Markets
  • Opinion
  • Politics
  • RSS Feed
  • Startup
  • Tech
  • Trading Signals
  • Uncategorized
  • World

Site Navigation

  • Home
  • Market News
  • Economic Calendar
  • About Us
  • Trading Signals
  • Free Demo Account
  • Home
  • Market News
  • Economic Calendar
  • About Us
  • Trading Signals
  • Free Demo Account

© 2019 High Leverage FX - All Rights Reserved.

No Result
View All Result
  • Home
  • Market News
    • Forex
    • Economy
    • Opinion
    • World
    • Markets
    • Politics
  • Economic Calendar
  • Trading Signals
  • About Us
  • Free Demo Account
[gtranslate]

© 2019 High Leverage FX - All Rights Reserved.