fbpx
High Leverage FX
  • Home
  • Market News
    • All
    • Economy
    • Forex
    • Markets
    • Opinion
    • Politics
    • Tech
    • World
    Asian stock markets poised for potential losses in the wake of Wall Street’s downturn

    Asian stock markets poised for potential losses in the wake of Wall Street’s downturn

    Asian equities observe positive start as optimism on Wall Street echoes

    Asian stocks may face headwinds after sell-off on Wall Street

    Asia equities trading mixed following similar performance on Wall Street

    Asian markets poised to react positively

    USD/MYR Technical Analysis

    USD/MYR Technical Analysis

    Asia equities trading sideways following choppy price action on Wall Street

    Asian equities poised for positive trading following volatile session on Wall Street

  • Economic Calendar
  • About Us
  • Trading Signals
  • Free Demo Account
High Leverage FX
No Result
View All Result
Home Market News Forex

Gold Technical Analysis – Could be headed lower

Nathan Batchelor by Nathan Batchelor
April 27, 2022
in Forex
Reading Time: 3 mins read
0
Gold Technical Analysis – Could be headed lower
412
SHARES
12.5k
VIEWS
Share on FacebookShare on Twitter

Gold has moved back towards the $1,900 level as the US dollar index breaks to a multi-year high and risk-off themes stemming from the Chinese lockdowns and negative geopolitical implications.

The yellow metal usually has a negative price correlation with the US dollar index, and this is exactly what we are seeing now as gold falters while the US dollar roars towards the 103.00 level.

To make things worse, Russian’s Foreign Minister said yesterday that NATO is on the brink of war with Russia. This caused a sea of red of global stocks and commodity prices. 

Meanwhile, data showed US Consumer Confidence edged lower in April to add yet more pressure to the bearish economic sentiment, which is getting worse from the Beijing and Shanghai lockdowns.

Other precious metals were hit hard, with both silver and copper hurting badly due to the obvious economic implications that subdued demand for economic goods cause these metals.

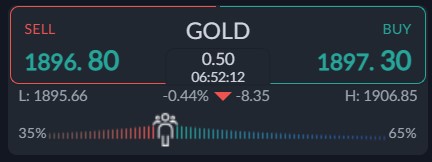
Current sentiment metric towards gold show that traders are bullish, but not overly bullish towards the price of gold The ActivTrader market sentiment tool shows that 65 percent of traders are bullish towards gold.          

With this strong way sentiment bias it is not bullish for gold prices as retail are usually wrong. However, it should be noted that sentiment has dropped by nearly 25 percent since last week.

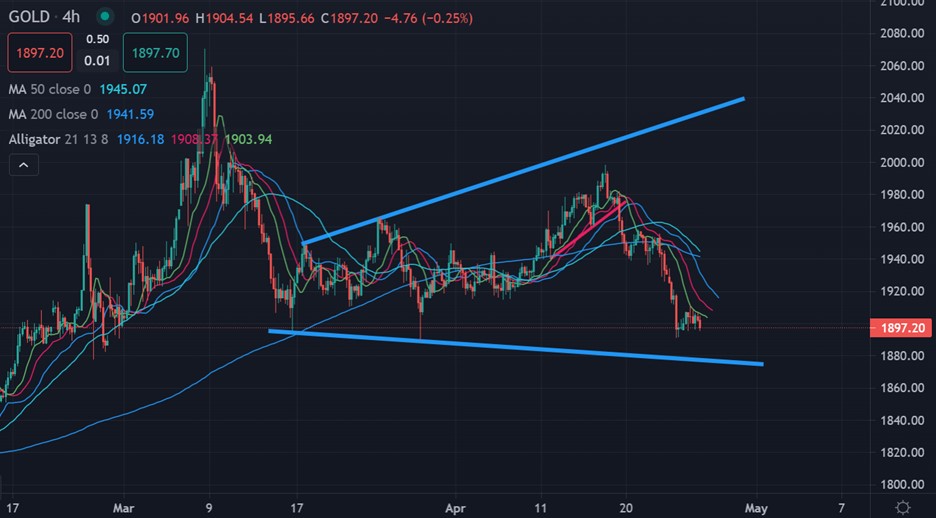
Gold short-term Technical Analysis

The short-term technicals for the yellow metal shows that a technical pullback appears to be underway, following a big technical rejection from the $2,000 price level.

Looking at the well-denoted pattern on the four-hour price chart, a coming price correction towards the towards the bottom of a falling trendline seems likely intraday, towards the $1,880 support area.

See real-time quotes provided by our partner.

Gold Medium-term Technical Analysis

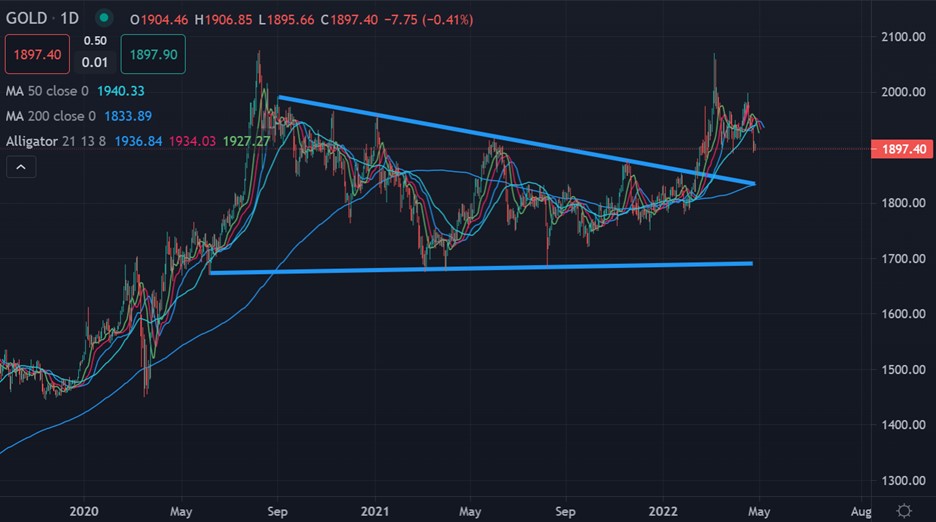
The daily chart shows that gold remains a strong buy while trading above the $1,800 level, which is the location of the 200-day moving average of the yellow metal.

I would expect that the price of gold could hit $17,400 if its losses the 200-day moving average. If not, we should probably expect a retest of the $1,800 resistance level.

See real-time quotes provided by our partner.

Tags: COPPERGoldSilverUS Dollar index
Previous Post

DXY Technical Analysis - Bull Run Not Done

Next Post

USDMYR Technical Analysis

Nathan Batchelor

Nathan Batchelor

Related Posts

USD/MYR Technical Analysis
Forex

USD/MYR Technical Analysis

October 25, 2023
USDMYR Technical Analysis
Forex

USD/MYR Technical Analysis

October 24, 2023
USD/MYR Technical Analysis
Forex

USD/MYR Technical Analysis

October 20, 2023
USDMYR Technical Analysis
Forex

USD/MYR Technical Analysis

October 17, 2023
USD/MYR Technical Analysis
Forex

USD/MYR Technical Analysis

October 12, 2023
USDMYR Technical Analysis
Forex

USD/MYR Technical Analysis

October 11, 2023
Next Post
USDMYR Technical Analysis

USDMYR Technical Analysis

Leave a Reply Cancel reply

Your email address will not be published. Required fields are marked *


Market Overview

Categories

  • Economy
  • Forex
  • Gadget
  • Markets
  • Opinion
  • Politics
  • RSS Feed
  • Startup
  • Tech
  • Trading Signals
  • Uncategorized
  • World

Site Navigation

  • Home
  • Market News
  • Economic Calendar
  • About Us
  • Trading Signals
  • Free Demo Account
  • Home
  • Market News
  • Economic Calendar
  • About Us
  • Trading Signals
  • Free Demo Account

© 2019 High Leverage FX - All Rights Reserved.

No Result
View All Result
  • Home
  • Market News
    • Forex
    • Economy
    • Opinion
    • World
    • Markets
    • Politics
  • Economic Calendar
  • Trading Signals
  • About Us
  • Free Demo Account
[gtranslate]

© 2019 High Leverage FX - All Rights Reserved.