fbpx
High Leverage FX
  • Home
  • Market News
    • All
    • Economy
    • Forex
    • Markets
    • Opinion
    • Politics
    • Tech
    • World
    Asian stock markets poised for potential losses in the wake of Wall Street’s downturn

    Asian stock markets poised for potential losses in the wake of Wall Street’s downturn

    Asian equities observe positive start as optimism on Wall Street echoes

    Asian stocks may face headwinds after sell-off on Wall Street

    Asia equities trading mixed following similar performance on Wall Street

    Asian markets poised to react positively

    USD/MYR Technical Analysis

    USD/MYR Technical Analysis

    Asia equities trading sideways following choppy price action on Wall Street

    Asian equities poised for positive trading following volatile session on Wall Street

  • Economic Calendar
  • About Us
  • Trading Signals
  • Free Demo Account
High Leverage FX
No Result
View All Result
Home Market News Markets

Dow Jones Industrial Average Technical Analysis – Turning Bullish Above 35,000

Nathan Batchelor by Nathan Batchelor
March 25, 2022
in Markets
Reading Time: 3 mins read
0
Dow Jones Industrial Average Technical Analysis – Turning Bullish Above 35,000
362
SHARES
11.9k
VIEWS
Share on FacebookShare on Twitter

The Dow Jones Industrial Average has posted 6-days of gains after the last 7-days of trading as the blue-chip heavy US index shows strong signs of turning technically bullish once again.

Traders have swept aside fears about the Ukraine, and some stocks inside the DJIA are starting to move back towards, and even above their pre-Ukraine price levels, which is staggering.

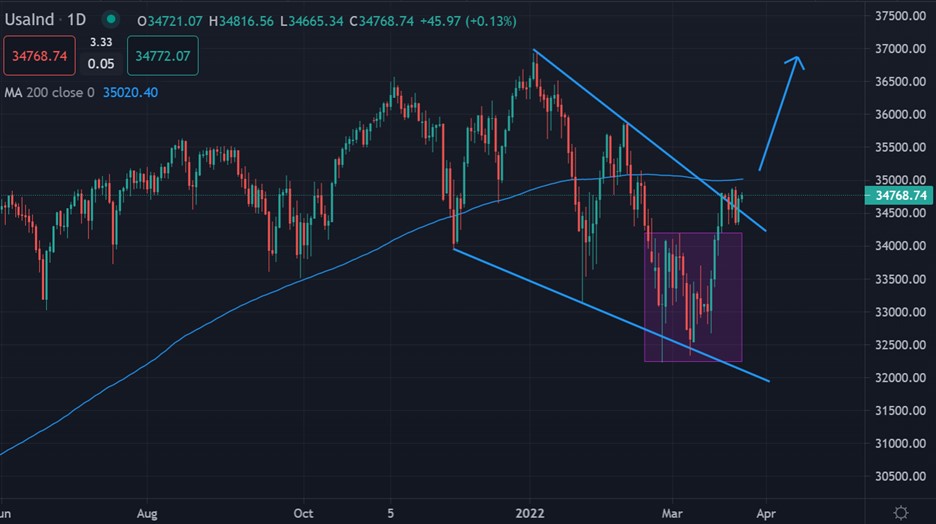
The DJIA is now starting to approach the 35,000-resistance level which is a massive market pivot. Should we see the index trading above the 35,000 level the upside acceleration could explode.

With the Dow Jones Industrial Average approaching the 35,000 level, the index’s 200-day moving average is also located around this key level, making it even more important technically.

Big psychological numbers are closely watched by stock trading, meaning that the break of the 35,000 level is very important. With a coming break of the 200-DMA and the 35,000 level the Dow Jones Industrial Average could easily explode.

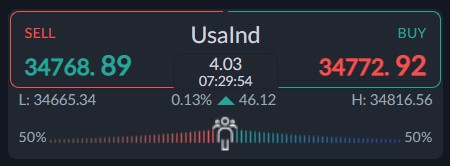
Additionally, historical sentiment data clearly shows that traders are neutral and not all extremely bullish towards DJIA as it starts to approach the 35,000 level. This could be bullish as the retail crowd looks the other way.

According the ActivTrader sentiment tool some 50 percent of traders are bullish towards the DJIA. If we see sentiment starting to turn bearish, I suspect it could serve to speed up the bulls’ case here.

Dow Jones Industrial Average Short-Term Technical Analysis

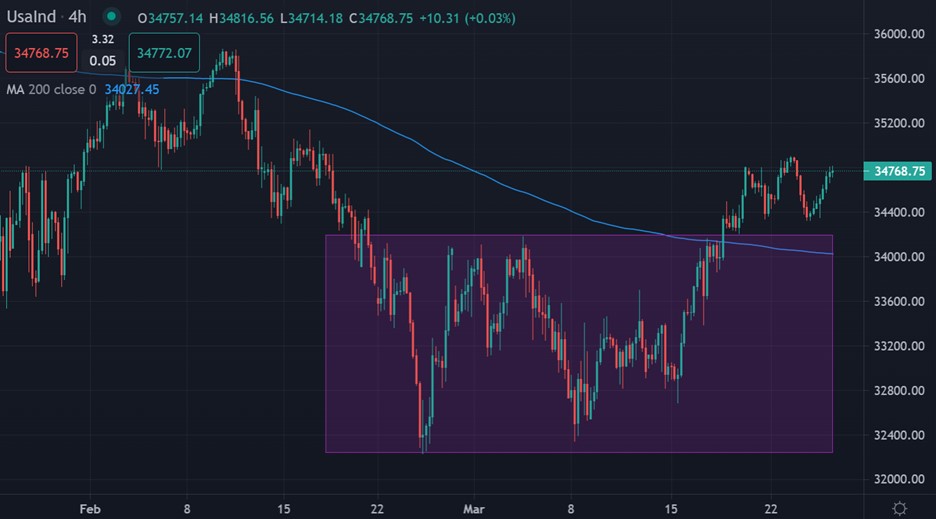
The four-hour time frame shows that a head and shoulders pattern has officially been invalidated. These patterns are typically amongst the most bearish reversal patterns, so big upside moves can happen when they are invalidated

According to the size of the pattern, the overall bullish invalidation target could provoke a move towards the 36,000 level could take place, as the pattern holds an upside projection of around 2,000 points.

See real-time quotes provided by our partner.

Dow Jones Industrial Average Medium-Term Technical Analysis

Looking at the daily time frame, the trend is still bearish, and the price is currently very close to the DJIA 200-day moving average, currently around the 35,000-resistance level.

Typically, we need to see a few days back above the 200-day moving average, and then trend traders jump in, and we could then see a massive price move to the upside for the DJIA.

See real-time quotes provided by our partner.

Tags: DJIA
Previous Post

USDMYR Technical Analysis

Next Post

USDCAD finds support at 1.2510 as oil comes off its highs

Nathan Batchelor

Nathan Batchelor

Related Posts

Asian stock markets poised for potential losses in the wake of Wall Street’s downturn
Markets

Asian stock markets poised for potential losses in the wake of Wall Street’s downturn

October 27, 2023
Asian equities observe positive start as optimism on Wall Street echoes
Markets

Asian stocks may face headwinds after sell-off on Wall Street

October 26, 2023
Asia equities trading mixed following similar performance on Wall Street
Markets

Asian markets poised to react positively

October 25, 2023
Asia equities trading sideways following choppy price action on Wall Street
Markets

Asian equities poised for positive trading following volatile session on Wall Street

October 24, 2023
Asian markets poised for cautious trading amidst global geopolitical tensions
Markets

Asian markets poised for cautious trading amidst global geopolitical tensions

October 20, 2023
Asian equities observe positive start as optimism on Wall Street echoes
Markets

Asian markets appear poised for cautious stance following Wall Street’s retreat from risk

October 19, 2023
Next Post
USDCAD finds support at 1.2510 as oil comes off its highs

USDCAD finds support at 1.2510 as oil comes off its highs

Leave a Reply Cancel reply

Your email address will not be published. Required fields are marked *


Market Overview

Categories

  • Economy
  • Forex
  • Gadget
  • Markets
  • Opinion
  • Politics
  • RSS Feed
  • Startup
  • Tech
  • Trading Signals
  • Uncategorized
  • World

Site Navigation

  • Home
  • Market News
  • Economic Calendar
  • About Us
  • Trading Signals
  • Free Demo Account
  • Home
  • Market News
  • Economic Calendar
  • About Us
  • Trading Signals
  • Free Demo Account

© 2019 High Leverage FX - All Rights Reserved.

No Result
View All Result
  • Home
  • Market News
    • Forex
    • Economy
    • Opinion
    • World
    • Markets
    • Politics
  • Economic Calendar
  • Trading Signals
  • About Us
  • Free Demo Account
[gtranslate]

© 2019 High Leverage FX - All Rights Reserved.