fbpx
High Leverage FX
  • Home
  • Market News
    • All
    • Economy
    • Forex
    • Markets
    • Opinion
    • Politics
    • Tech
    • World
    Asian stock markets poised for potential losses in the wake of Wall Street’s downturn

    Asian stock markets poised for potential losses in the wake of Wall Street’s downturn

    Asian equities observe positive start as optimism on Wall Street echoes

    Asian stocks may face headwinds after sell-off on Wall Street

    Asia equities trading mixed following similar performance on Wall Street

    Asian markets poised to react positively

    USD/MYR Technical Analysis

    USD/MYR Technical Analysis

    Asia equities trading sideways following choppy price action on Wall Street

    Asian equities poised for positive trading following volatile session on Wall Street

  • Economic Calendar
  • About Us
  • Trading Signals
  • Free Demo Account
High Leverage FX
No Result
View All Result
Home Market News Forex

Gold Technical Analysis – Bearish under $1,680

Nathan Batchelor by Nathan Batchelor
October 12, 2022
in Forex
Reading Time: 3 mins read
0
Gold Technical Analysis – Bearish under $1,680
458
SHARES
16.1k
VIEWS
Share on FacebookShare on Twitter

Gold prices have fallen back under the important $1,680 after the yellow metal saw renewed selling due to safe-haven demand for the greenback due to a number of factors.

With the inverse relationship gold shares with the US dollar index it is possible that further downside lay ahead. This is especially so if we see the US dollar index cracking the 115.00 level.

Traders should be very cautious towards this recent price decline under the $1,680 level while it remains, and gold starts to stabilize under this key former breakout zone.

Going forward I expect that the US CPI report will dictate the state of play for gold. Should we see a strong CPI number it is possible that gold is going to head back towards the lows of the year.

I would also suggest that gold has been sensitive to geopolitical news. Gold has been under pressure on bearish Ukrainian war news because the greenback has again benefitted from safe haven flows.

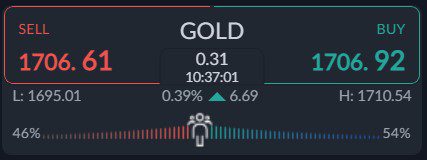
Current sentiment metric towards gold shows that sentiment has remained the same since last week, which could hint an eventual bearish breakdown in the price of gold.

The ActivTrader market sentiment tool shows that 54 percent of traders are bullish towards gold. Going forward, we really need to see a negative bias by retail to help the chances of a sustained recovery.

Current sentiment metrics may make do not make it difficult for gold price to rally, especially with this key tech levels now broken.

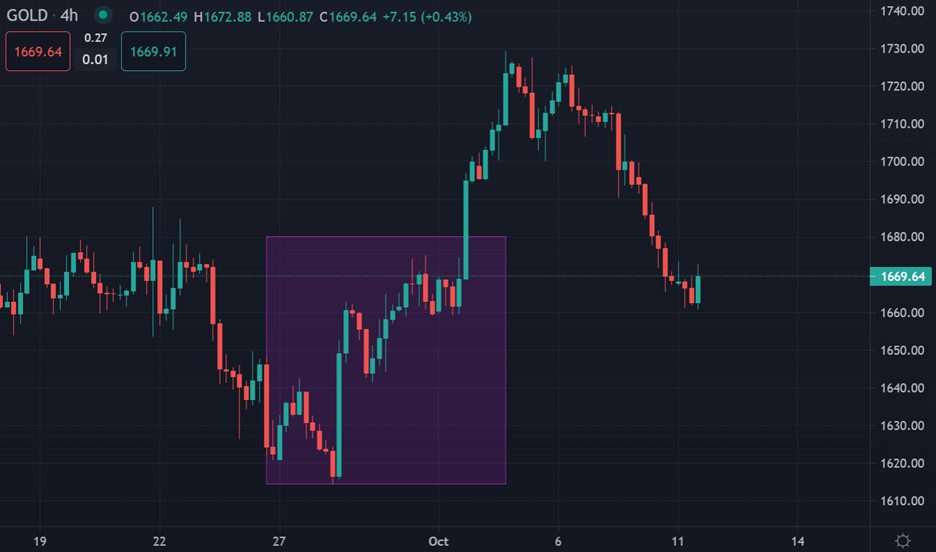
Gold short-term Technical Analysis

According to technical analysis gold the price of gold has moved back towards the middle of the range on the four-hour time frame.

According to technical analysis gold is now trapped in range trading between the $1,610 and $1,730 resistance levels. The $1,680 level is the natural pivot.

See real-time quotes provided by our partner.

Gold Medium-term Technical Analysis

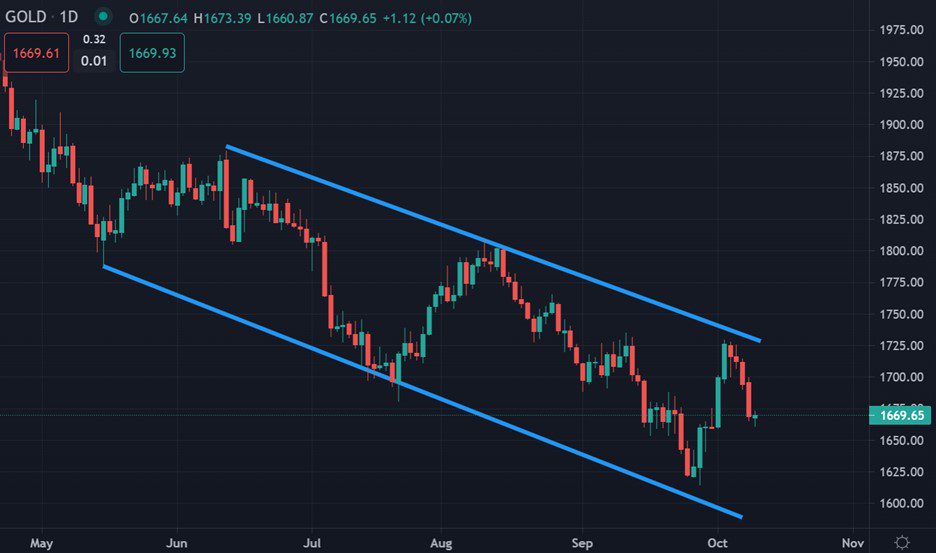
The daily chart shows that the yellow metal fast broken from a falling wedge pattern. These type of price patterns are known to be amongst the most bullish reversal patterns.

Looking at the bullish pattern and the fact gold is in bear market, at a very minimum, we could see the price of gold moving the $1,25 level, or even higher around the $1,820 towards its 200-day moving average if the wedge is broken.

See real-time quotes provided by our partner.

Tags: GoldUS CPIUS Dollar index
Previous Post

Market Insight - Top Sentiment Trades This Week

Next Post

USDMYR Technical Analysis

Nathan Batchelor

Nathan Batchelor

Related Posts

USD/MYR Technical Analysis
Forex

USD/MYR Technical Analysis

October 25, 2023
USDMYR Technical Analysis
Forex

USD/MYR Technical Analysis

October 24, 2023
USD/MYR Technical Analysis
Forex

USD/MYR Technical Analysis

October 20, 2023
USDMYR Technical Analysis
Forex

USD/MYR Technical Analysis

October 17, 2023
USD/MYR Technical Analysis
Forex

USD/MYR Technical Analysis

October 12, 2023
USDMYR Technical Analysis
Forex

USD/MYR Technical Analysis

October 11, 2023
Next Post
USD/MYR Technical Analysis

USDMYR Technical Analysis

Leave a Reply Cancel reply

Your email address will not be published. Required fields are marked *


Market Overview

Categories

  • Economy
  • Forex
  • Gadget
  • Markets
  • Opinion
  • Politics
  • RSS Feed
  • Startup
  • Tech
  • Trading Signals
  • Uncategorized
  • World

Site Navigation

  • Home
  • Market News
  • Economic Calendar
  • About Us
  • Trading Signals
  • Free Demo Account
  • Home
  • Market News
  • Economic Calendar
  • About Us
  • Trading Signals
  • Free Demo Account

© 2019 High Leverage FX - All Rights Reserved.

No Result
View All Result
  • Home
  • Market News
    • Forex
    • Economy
    • Opinion
    • World
    • Markets
    • Politics
  • Economic Calendar
  • Trading Signals
  • About Us
  • Free Demo Account
[gtranslate]

© 2019 High Leverage FX - All Rights Reserved.