fbpx
High Leverage FX
  • Home
  • Market News
    • All
    • Economy
    • Forex
    • Markets
    • Opinion
    • Politics
    • Tech
    • World
    Asian stock markets poised for potential losses in the wake of Wall Street’s downturn

    Asian stock markets poised for potential losses in the wake of Wall Street’s downturn

    Asian equities observe positive start as optimism on Wall Street echoes

    Asian stocks may face headwinds after sell-off on Wall Street

    Asia equities trading mixed following similar performance on Wall Street

    Asian markets poised to react positively

    USD/MYR Technical Analysis

    USD/MYR Technical Analysis

    Asia equities trading sideways following choppy price action on Wall Street

    Asian equities poised for positive trading following volatile session on Wall Street

  • Economic Calendar
  • About Us
  • Trading Signals
  • Free Demo Account
High Leverage FX
No Result
View All Result
Home Market News Forex

DXY Technical Analysis – Wedge Break Happening

Nathan Batchelor by Nathan Batchelor
August 12, 2022
in Forex
Reading Time: 3 mins read
0
DXY Technical Analysis – Wedge Break Happening
470
SHARES
15.2k
VIEWS
Share on FacebookShare on Twitter

The US dollar index has started to move under a large wedge pattern threatening a technical meltdown after Thursday’s Producer Price Inflation Index number came in weaker than expected.

Market reacted by selling the greenback as the PPI number further complimented the weak CPI reading in July. Markets are now expecting that the Fed will start to act less aggressively regarding rates.

Inside the PPI report for July, it was shown the PPI excluding food and energy rose by 0.2%, which was much better than the expected 0.4% rise. Additionally, normal PPI, which includes food and energy contracted.

The monthly headline reading of -0.5% month on month send the US dollar index crashing, and as mentioned earlier the technical set-up for the US dollar index looks like one of more short-term weakness ahead.

I expect that US dollar weakness will be the dominant theme going into Jackson Hole. The meeting is two-weeks away and I think that over this time the sell the greenback trade could accelerate.

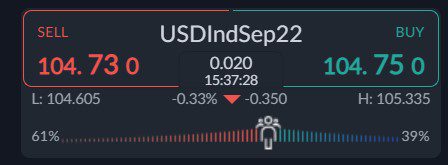
According to the ActivTrader Market Sentiment tool a whopping 61% of traders are bearish towards the US dollar index, which strongly hints that the losses in the greenback could be about to slow.

However, it should be noted that nearly 80% of traders were long the US dollar index in early week trade. I think it’s possible that a monumental, long squeeze is also underway, and the downside could also accelerate.

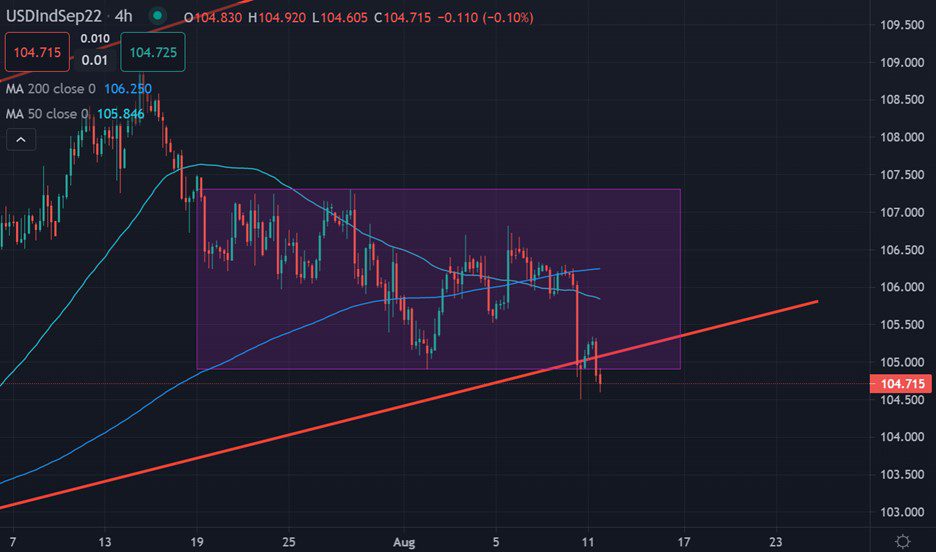
US dollar index Short-Term Technical Analysis

Technical analysis on the four-hour time frame shows that the US dollar index has invalidated a large, inverted head and shoulders pattern. This is a very bearish sign technically.

According to the overall size of the bullish reversal pattern being invalidated, it shows that the US dollar index could be preparing to stage a move towards the 103.00 support area.

See real-time quotes provided by our partner.

US dollar index Medium-Term Technical Analysis

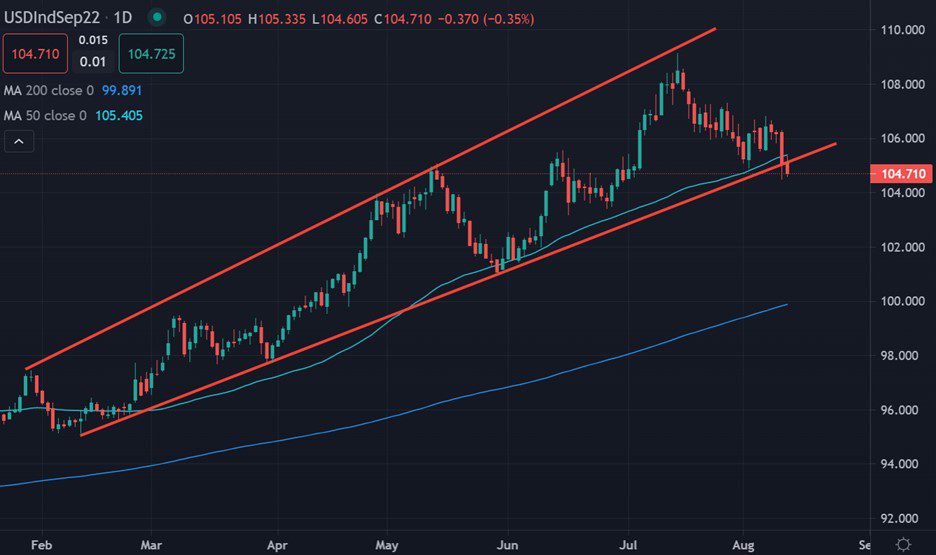
The daily time frame is showing that US dollar index has started to trade under its 50-period moving average, which means that a sell signal is now generated, and the 100-day or 200-day moving average could be the next target.

Additionally, a massive wedge breakout is underway. The wedge breakout looks particularly bearish for the US dollar index, and we could well see more weakness coming.

See real-time quotes provided by our partner.

Tags: US Dollar indexUS PPI
Previous Post

Morning Brief - Trend of The Day

Next Post

Nasdaq Technical Analysis - Ready To Explode

Nathan Batchelor

Nathan Batchelor

Related Posts

USD/MYR Technical Analysis
Forex

USD/MYR Technical Analysis

October 25, 2023
USDMYR Technical Analysis
Forex

USD/MYR Technical Analysis

October 24, 2023
USD/MYR Technical Analysis
Forex

USD/MYR Technical Analysis

October 20, 2023
USDMYR Technical Analysis
Forex

USD/MYR Technical Analysis

October 17, 2023
USD/MYR Technical Analysis
Forex

USD/MYR Technical Analysis

October 12, 2023
USDMYR Technical Analysis
Forex

USD/MYR Technical Analysis

October 11, 2023
Next Post
Nasdaq Technical Analysis – Ready To Explode

Nasdaq Technical Analysis - Ready To Explode

Leave a Reply Cancel reply

Your email address will not be published. Required fields are marked *


Market Overview

Categories

  • Economy
  • Forex
  • Gadget
  • Markets
  • Opinion
  • Politics
  • RSS Feed
  • Startup
  • Tech
  • Trading Signals
  • Uncategorized
  • World

Site Navigation

  • Home
  • Market News
  • Economic Calendar
  • About Us
  • Trading Signals
  • Free Demo Account
  • Home
  • Market News
  • Economic Calendar
  • About Us
  • Trading Signals
  • Free Demo Account

© 2019 High Leverage FX - All Rights Reserved.

No Result
View All Result
  • Home
  • Market News
    • Forex
    • Economy
    • Opinion
    • World
    • Markets
    • Politics
  • Economic Calendar
  • Trading Signals
  • About Us
  • Free Demo Account
[gtranslate]

© 2019 High Leverage FX - All Rights Reserved.