fbpx
High Leverage FX
  • Home
  • Market News
    • All
    • Economy
    • Forex
    • Markets
    • Opinion
    • Politics
    • Tech
    • World
    Asian stock markets poised for potential losses in the wake of Wall Street’s downturn

    Asian stock markets poised for potential losses in the wake of Wall Street’s downturn

    Asian equities observe positive start as optimism on Wall Street echoes

    Asian stocks may face headwinds after sell-off on Wall Street

    Asia equities trading mixed following similar performance on Wall Street

    Asian markets poised to react positively

    USD/MYR Technical Analysis

    USD/MYR Technical Analysis

    Asia equities trading sideways following choppy price action on Wall Street

    Asian equities poised for positive trading following volatile session on Wall Street

  • Economic Calendar
  • About Us
  • Trading Signals
  • Free Demo Account
High Leverage FX
No Result
View All Result
Home Market News Forex

Gold Technical Analysis – Why is the $1,830 level so important this week?

Nathan Batchelor by Nathan Batchelor
January 17, 2022
in Forex
Reading Time: 3 mins read
0
Gold price is skyrocketing
403
SHARES
12k
VIEWS
Share on FacebookShare on Twitter

Gold is set for another big week on the precious metals market as the yellow metal flirts with the psychological $1,800 level amidst a backdrop of heavy US dollar selling and tech stock uncertainty.

The yellow metal has arguably benefitted from early-year seasonal trends, i.e. Chinese new year buying, the ongoing inflation narrative, and also the mentioned sell-off in the greenback against most major currencies.

Chinese new year is just two-weeks away now. As mentioned earlier I do believe we could see seasonal buying, but it will be interesting to see what happens after seasonal gold buying end.

This week the market will pay particularly attention to Chinese data, such as the PBOC rate decision and the Q4 number from the world’s second-largest economy. This could also be a market mover for gold.

One thing to watch this week is the technical towards gold, specifically the $1,830 resistance level. The key technical area has been a price zone that gold bugs have not been able to break for months.

This area is important not only because of the numerous technical rejections from this area, but also because it is the location of a key falling trendline on the monthly time frame. Watch this area closely this week.

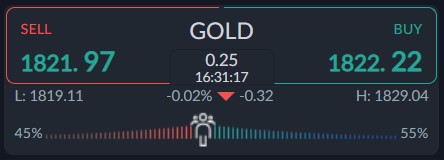
Current sentiment metric towards gold show that traders are becoming fairly neutralized. The ActivTrader market sentiment tool shows that 55 percent of traders are bullish towards gold.

This bullish sentiment bias towards gold suggest that gold can still rally, as traders really aren’t that bullish towards the metal, which is typically a great sign.

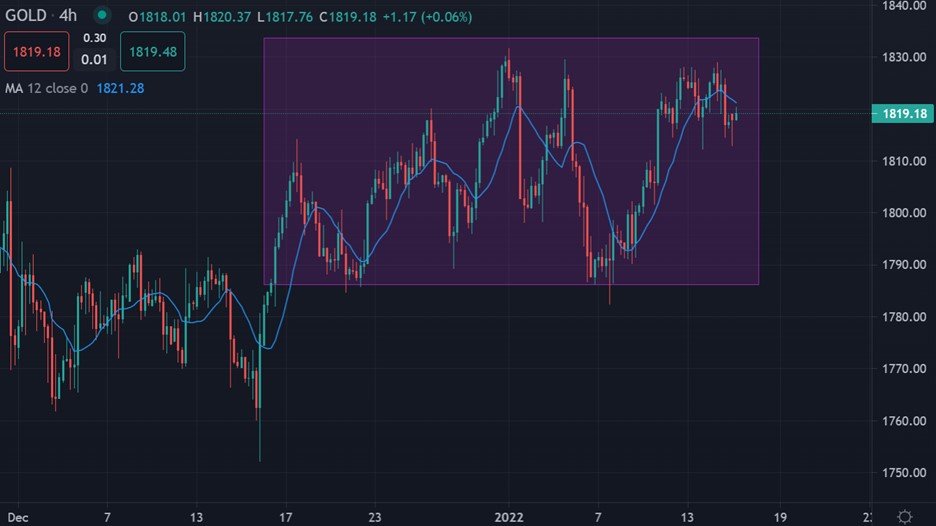
Gold short-term Technical Analysis

The short-term technicals for the yellow-metal show that a large head and shoulders pattern has been formed, following the recent price rejection from the $1,870 level.

Looking at the four-hour price chart, the $1,830 resistance level is so important because it is the top of the bearish pattern and obviously the main invalidation point of the price pattern.

See real-time quotes provided by our partner.

Gold Medium-term Technical Analysis

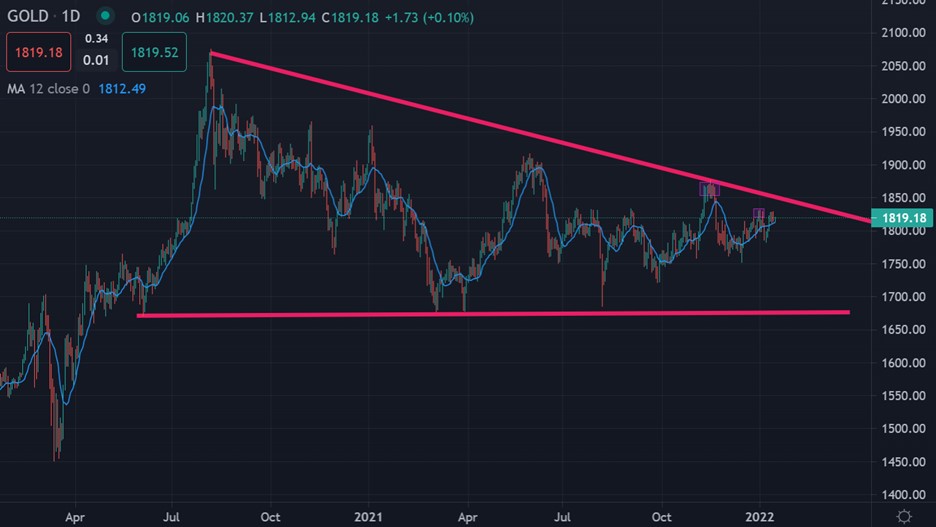
The daily weekly chart shows that gold still remains a buy this week while trading above the $1,780 level. Please be aware a big drop is possible if gold losses the $1,780 level.

If a bearish breakout takes place then the $1,730 level offer the last layer of support. Under $1,730 we should see the $1,680 quickly coming into focus.

See real-time quotes provided by our partner.

Tags: GoldUS dollar
Previous Post

EURUSD Technical Analysis - 1.1390 Is the key level this week

Next Post

USD/MYR Technical Analysis

Nathan Batchelor

Nathan Batchelor

Related Posts

USD/MYR Technical Analysis
Forex

USD/MYR Technical Analysis

October 25, 2023
USDMYR Technical Analysis
Forex

USD/MYR Technical Analysis

October 24, 2023
USD/MYR Technical Analysis
Forex

USD/MYR Technical Analysis

October 20, 2023
USDMYR Technical Analysis
Forex

USD/MYR Technical Analysis

October 17, 2023
USD/MYR Technical Analysis
Forex

USD/MYR Technical Analysis

October 12, 2023
USDMYR Technical Analysis
Forex

USD/MYR Technical Analysis

October 11, 2023
Next Post
USD/MYR Technical Analysis

USD/MYR Technical Analysis

Leave a Reply Cancel reply

Your email address will not be published. Required fields are marked *


Market Overview

Categories

  • Economy
  • Forex
  • Gadget
  • Markets
  • Opinion
  • Politics
  • RSS Feed
  • Startup
  • Tech
  • Trading Signals
  • Uncategorized
  • World

Site Navigation

  • Home
  • Market News
  • Economic Calendar
  • About Us
  • Trading Signals
  • Free Demo Account
  • Home
  • Market News
  • Economic Calendar
  • About Us
  • Trading Signals
  • Free Demo Account

© 2019 High Leverage FX - All Rights Reserved.

No Result
View All Result
  • Home
  • Market News
    • Forex
    • Economy
    • Opinion
    • World
    • Markets
    • Politics
  • Economic Calendar
  • Trading Signals
  • About Us
  • Free Demo Account
[gtranslate]

© 2019 High Leverage FX - All Rights Reserved.