fbpx
High Leverage FX
  • Home
  • Market News
    • All
    • Economy
    • Forex
    • Markets
    • Opinion
    • Politics
    • Tech
    • World
    Asian stock markets poised for potential losses in the wake of Wall Street’s downturn

    Asian stock markets poised for potential losses in the wake of Wall Street’s downturn

    Asian equities observe positive start as optimism on Wall Street echoes

    Asian stocks may face headwinds after sell-off on Wall Street

    Asia equities trading mixed following similar performance on Wall Street

    Asian markets poised to react positively

    USD/MYR Technical Analysis

    USD/MYR Technical Analysis

    Asia equities trading sideways following choppy price action on Wall Street

    Asian equities poised for positive trading following volatile session on Wall Street

  • Economic Calendar
  • About Us
  • Trading Signals
  • Free Demo Account
High Leverage FX
No Result
View All Result
Home Market News Forex

Gold Technical Analysis – $1,800 buy signal

Nathan Batchelor by Nathan Batchelor
October 22, 2021
in Forex
Reading Time: 3 mins read
0
Gold Technical Analysis – $1,800 buy signal
369
SHARES
9.2k
VIEWS
Share on FacebookShare on Twitter

The price of gold is starting to recover higher due to broad-based US dollar weakness and inflation fears. Precious metals are coming back into favour from central banks, as recent data showed record central bank buying.

The big breakout lower in the US dollar index has caused technical strength in gold above the $1,1770 level, meaning the recovery is not yet over for the yellow metal, and especially according to long-term technical analysis.

Gold bounced from a critical spot last month, meaning the $1,720 to $1,730 price area, and has rebound back towards the $1,800 resistance level, which is a hugely technical breakout out.

Firstly, the $1,800 level is the head of a large head and shoulders pattern, which holds a downside projection of $50.00. Personally, I think the chances are high that the pattern could be invalidated.

Secondly, we need to take a close look at the Parabolic SAR indicator. The weekly Parabolic SAR will flip to bullish for the first-time since June if the price crosses the $1,800 resistance level.

Earlier this month tentative signs of a major price floor were forming after the $1,720 price area held, providing a clue that a big bounce could be soon. Overall, watch out for a coming rally to the $1,850 level, and possibly even $1,900.

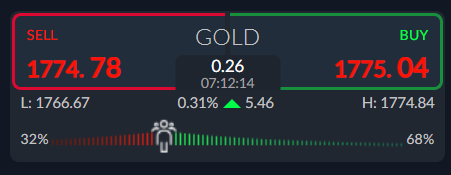
Current sentiment metric towards gold is suggesting further short-term losses are still likely. The ActivTrader market sentiment tool shows that 68 percent of traders are bullish towards gold.

We probably need to see a wholesale bearish shift in traders sentiment towards gold in order for the expected breakout above $1,800 to happen. I would suggest keeping a close eye on sentiment over the coming days.

Gold short-term Technical Analysis

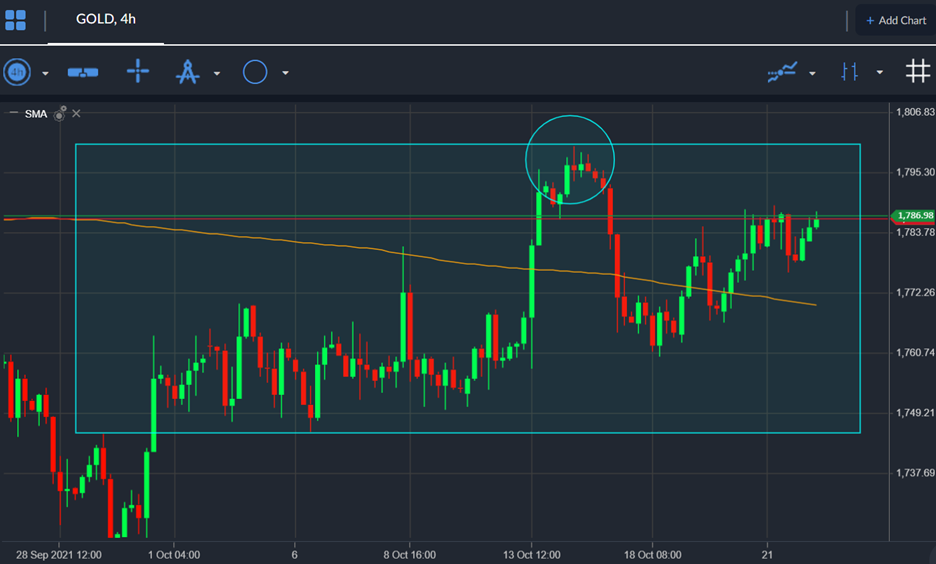
The short-term technicals for the yellow metal shows that a complex inverted head and shoulders pattern is starting to form. Similar to the bearish head and shoulders pattern I mentioned recently.

Looking at the four-hour price this could hint that a big recovery is coming when the pattern is activated, and the price closes the $1,830 level. The pattern is projected a move towards the $1,950 level.

See real-time quotes provided by our partner.

Gold Medium-term Technical Analysis

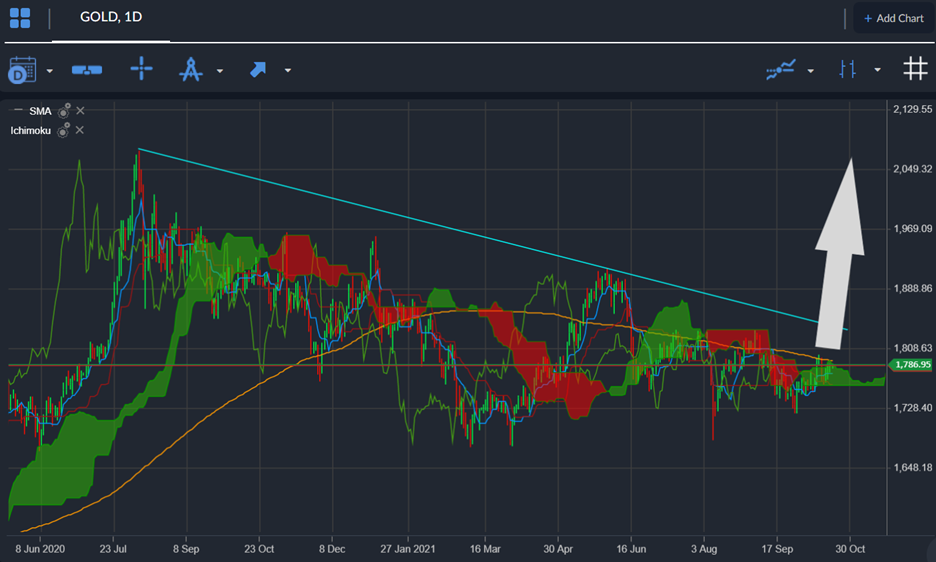
The weekly chart shows that gold could become a big buy above the $1,800 level soon. Should we a sustained move above the $1,800 level, then the Parabolic SAR on the weekly time frame will flip to green and issue a buy signal.

An explosive breakout above the $1,800 level is likely to prompt a test of the $1,900 level and finally, big upside targets such as $2,080 and $2,200 level.

Watch out for 100 percent confirmation of the coming price rally if bulls regain gold’s 200-day moving average to really get the bull party started again.

See real-time quotes provided by our partner.

Tags: Central banksGoldinflationUS Dollar index
Previous Post

Asia cross-assets trading with a light positive risk tone

Next Post

Tesla Technical Analysis - $1,000 Incoming?

Nathan Batchelor

Nathan Batchelor

Related Posts

USD/MYR Technical Analysis
Forex

USD/MYR Technical Analysis

October 25, 2023
USDMYR Technical Analysis
Forex

USD/MYR Technical Analysis

October 24, 2023
USD/MYR Technical Analysis
Forex

USD/MYR Technical Analysis

October 20, 2023
USDMYR Technical Analysis
Forex

USD/MYR Technical Analysis

October 17, 2023
USD/MYR Technical Analysis
Forex

USD/MYR Technical Analysis

October 12, 2023
USDMYR Technical Analysis
Forex

USD/MYR Technical Analysis

October 11, 2023
Next Post
Tesla Technical Analysis – $1,000 Incoming?

Tesla Technical Analysis - $1,000 Incoming?

Leave a Reply Cancel reply

Your email address will not be published. Required fields are marked *


Market Overview

Categories

  • Economy
  • Forex
  • Gadget
  • Markets
  • Opinion
  • Politics
  • RSS Feed
  • Startup
  • Tech
  • Trading Signals
  • Uncategorized
  • World

Site Navigation

  • Home
  • Market News
  • Economic Calendar
  • About Us
  • Trading Signals
  • Free Demo Account
  • Home
  • Market News
  • Economic Calendar
  • About Us
  • Trading Signals
  • Free Demo Account

© 2019 High Leverage FX - All Rights Reserved.

No Result
View All Result
  • Home
  • Market News
    • Forex
    • Economy
    • Opinion
    • World
    • Markets
    • Politics
  • Economic Calendar
  • Trading Signals
  • About Us
  • Free Demo Account
[gtranslate]

© 2019 High Leverage FX - All Rights Reserved.