fbpx
High Leverage FX
  • Home
  • Market News
    • All
    • Economy
    • Forex
    • Markets
    • Opinion
    • Politics
    • Tech
    • World
    Asian stock markets poised for potential losses in the wake of Wall Street’s downturn

    Asian stock markets poised for potential losses in the wake of Wall Street’s downturn

    Asian equities observe positive start as optimism on Wall Street echoes

    Asian stocks may face headwinds after sell-off on Wall Street

    Asia equities trading mixed following similar performance on Wall Street

    Asian markets poised to react positively

    USD/MYR Technical Analysis

    USD/MYR Technical Analysis

    Asia equities trading sideways following choppy price action on Wall Street

    Asian equities poised for positive trading following volatile session on Wall Street

  • Economic Calendar
  • About Us
  • Trading Signals
  • Free Demo Account
High Leverage FX
No Result
View All Result
Home Market News Tech

Nasdaq Technical Analysis – Looking lower

Nathan Batchelor by Nathan Batchelor
February 19, 2021
in Economy, Markets, Opinion, Tech
Reading Time: 3 mins read
0
Nasdaq Technical Analysis – Looking lower
411
SHARES
8.8k
VIEWS
Share on FacebookShare on Twitter

The Nasdaq has incurred three days of straight losses as investors rotate away from technology stocks due to growing fears about the United States inflationary pressure over the coming months.

Yesterday’s higher-than-expected jobless claims form the US economy was not supportive of technology stocks. The ongoing bad weather conditions in the United States and power outages in Texas were also seen as a drag on Nasdaq, especially internet reliant tech stocks.

Popular tech stocks inside the Nasdaq have led the decline this week as investors go on the hunt for yield elsewhere on Wall Street. However, the recent and potential ongoing decline is likely to be seen as a dip-buying opportunity from more attractive levels.

Signs of a market top are still far away, as tech stocks are probably just cooling-off after posting strong first-quarter gains. Potentially, this cooling period could be welcomed ahead of the upcoming US stimulus roll-out, which puts more money in the pocket of average Americans.

The technical surrounding the Nasdaq in the short-term certainly show scope for further downside, with the index’s 50-day moving average the big technical area to watch over the coming days and weeks if the decline continues.

At the time of writing the Nasdaq is testing towards its 21-day moving average. This is typically the key benchmark technical area to watch for signs of short-term weakness. Losses under the 21-day MA could provoke a test of the 50-day MA, around the 13,100-support area.

The ActivTrader Market sentiment took shows that some 57 percent of traders are bearish towards the Nasdaq. This is not a worrying level and may indicate further steady losses in the index. It is worth paying attention to this indicator if the 21-day moving average is broken.

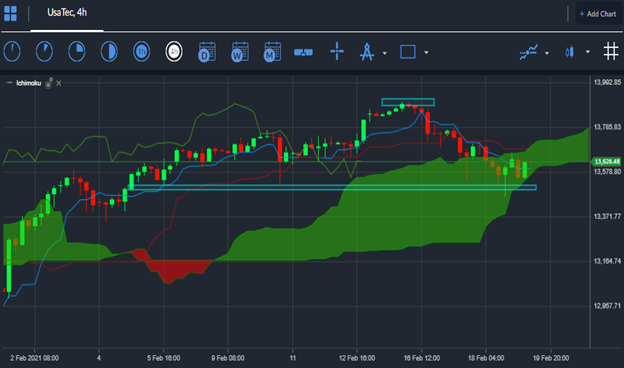
Nasdaq Short-Term Technical Analysis

The four-hour time frame shows that a head and shoulders pattern has formed, following the recent three-day decline in the index. Further heavy losses should be expected if the price moves under the 13,500 level.

A breakout under the 13,500 level is expected to cause the Nasdaq to decline towards the 13,100 to 13,000 areas. It is extremely likely that dip-buyers may be lurking around the mentioned downside price targets.

Source By ActivTrader.

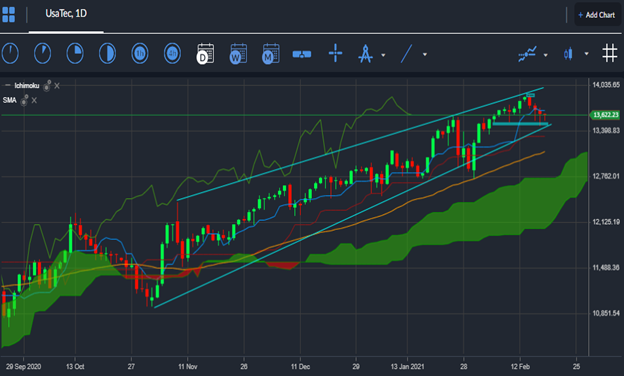
Nasdaq Medium-Term Technical Analysis

Looking at the daily price chart the Nasdaq is trapped inside a rising wedge pattern. Typically, these patterns are considered to be powerful bearish reversal patterns. It is noteworthy that both lower and higher time frame analysis now shows bearish patterns.

Weakness under the bottom of the wedge pattern, around the 13,500 level, could cause the index to plunge towards the index’s 50-day moving average, which is located around the 13,100 level.

Source By ActivTrader

The daily time frame also shows that cloud support from the Ichimoku indicator is located around the 12,800 level. This is likely to be the first line of support if the 13,000 level is breached.

Tags: NasdaqUS stimulus packageWall Street
Previous Post

Gold Technical Analysis - Targeting $1,760

Next Post

EURUSD Technical Analysis - Make or Break Time

Nathan Batchelor

Nathan Batchelor

Related Posts

Asian stock markets poised for potential losses in the wake of Wall Street’s downturn
Markets

Asian stock markets poised for potential losses in the wake of Wall Street’s downturn

October 27, 2023
Asian equities observe positive start as optimism on Wall Street echoes
Markets

Asian stocks may face headwinds after sell-off on Wall Street

October 26, 2023
Asia equities trading mixed following similar performance on Wall Street
Markets

Asian markets poised to react positively

October 25, 2023
Asia equities trading sideways following choppy price action on Wall Street
Markets

Asian equities poised for positive trading following volatile session on Wall Street

October 24, 2023
Asian markets poised for cautious trading amidst global geopolitical tensions
Markets

Asian markets poised for cautious trading amidst global geopolitical tensions

October 20, 2023
Asian equities observe positive start as optimism on Wall Street echoes
Markets

Asian markets appear poised for cautious stance following Wall Street’s retreat from risk

October 19, 2023
Next Post
EURUSD Technical Analysis – Make or Break Time

EURUSD Technical Analysis - Make or Break Time

Leave a Reply Cancel reply

Your email address will not be published. Required fields are marked *


Market Overview

Categories

  • Economy
  • Forex
  • Gadget
  • Markets
  • Opinion
  • Politics
  • RSS Feed
  • Startup
  • Tech
  • Trading Signals
  • Uncategorized
  • World

Site Navigation

  • Home
  • Market News
  • Economic Calendar
  • About Us
  • Trading Signals
  • Free Demo Account
  • Home
  • Market News
  • Economic Calendar
  • About Us
  • Trading Signals
  • Free Demo Account

© 2019 High Leverage FX - All Rights Reserved.

No Result
View All Result
  • Home
  • Market News
    • Forex
    • Economy
    • Opinion
    • World
    • Markets
    • Politics
  • Economic Calendar
  • Trading Signals
  • About Us
  • Free Demo Account
[gtranslate]

© 2019 High Leverage FX - All Rights Reserved.